PPFD Targets by Plant Type
The published bands, what sits in each, and the daily light integral each implies at realistic photoperiods.
By Scooter M. — An enthusiast who's genuinely into this. I read the manuals, compile the published specs, and do the math. No lab coat.
Published · How we pick
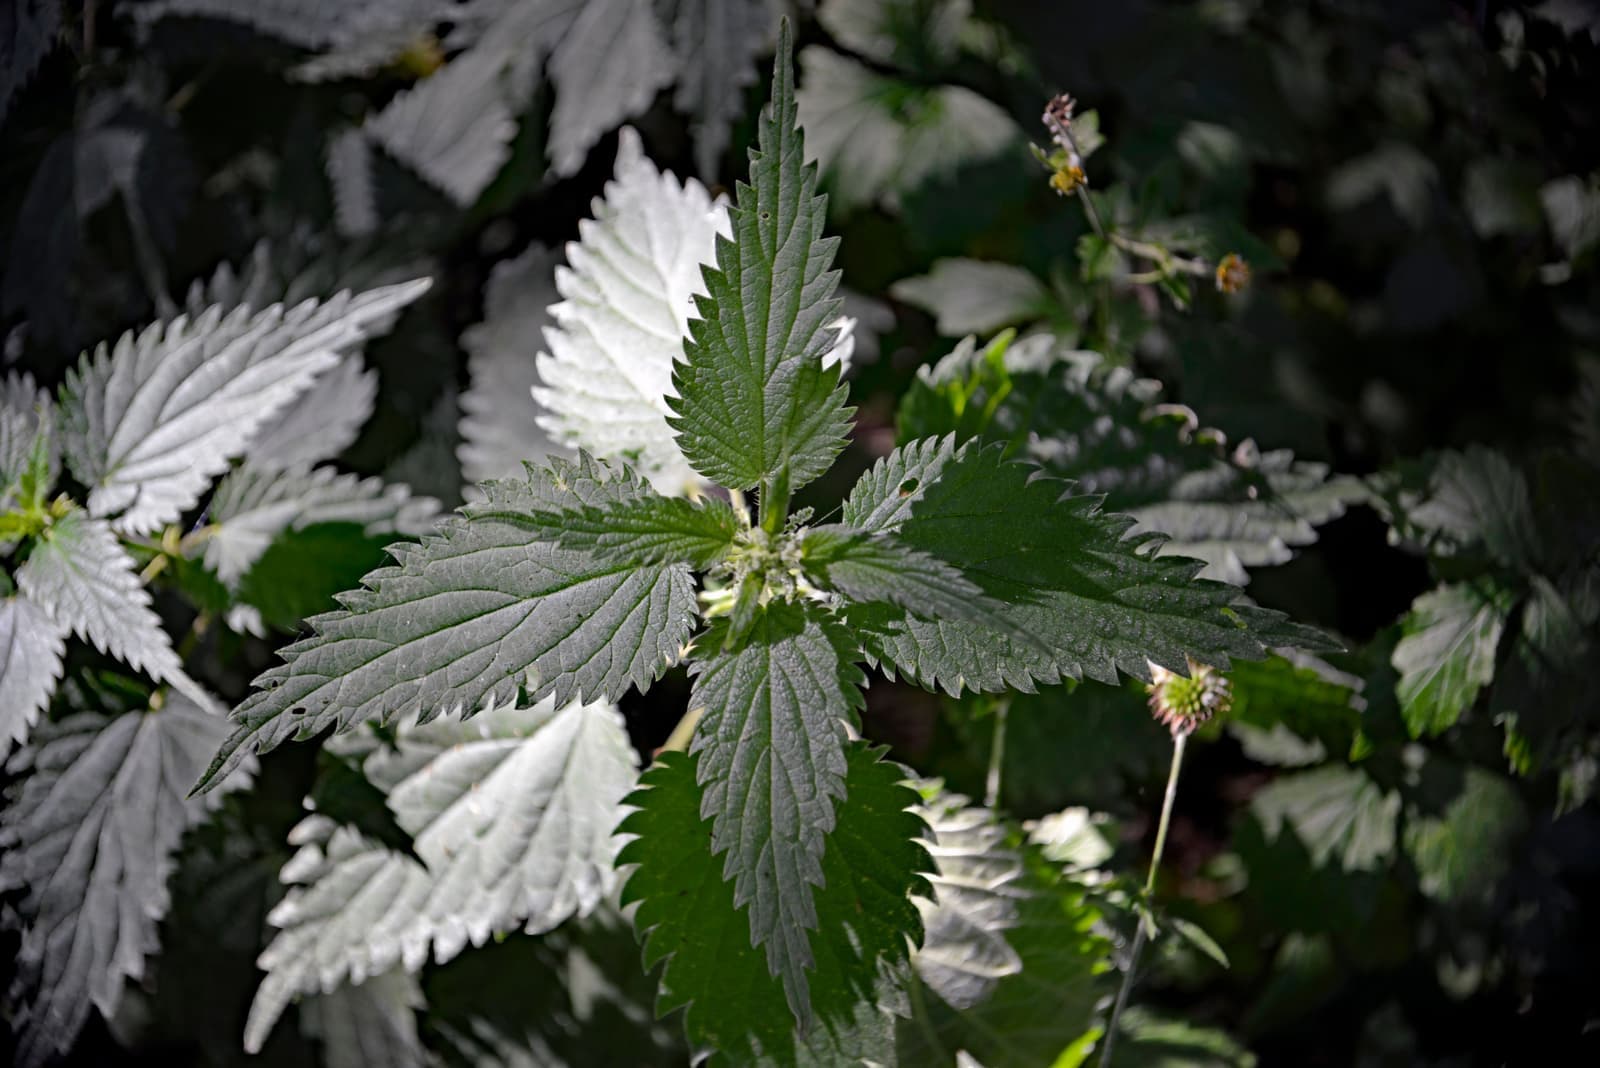
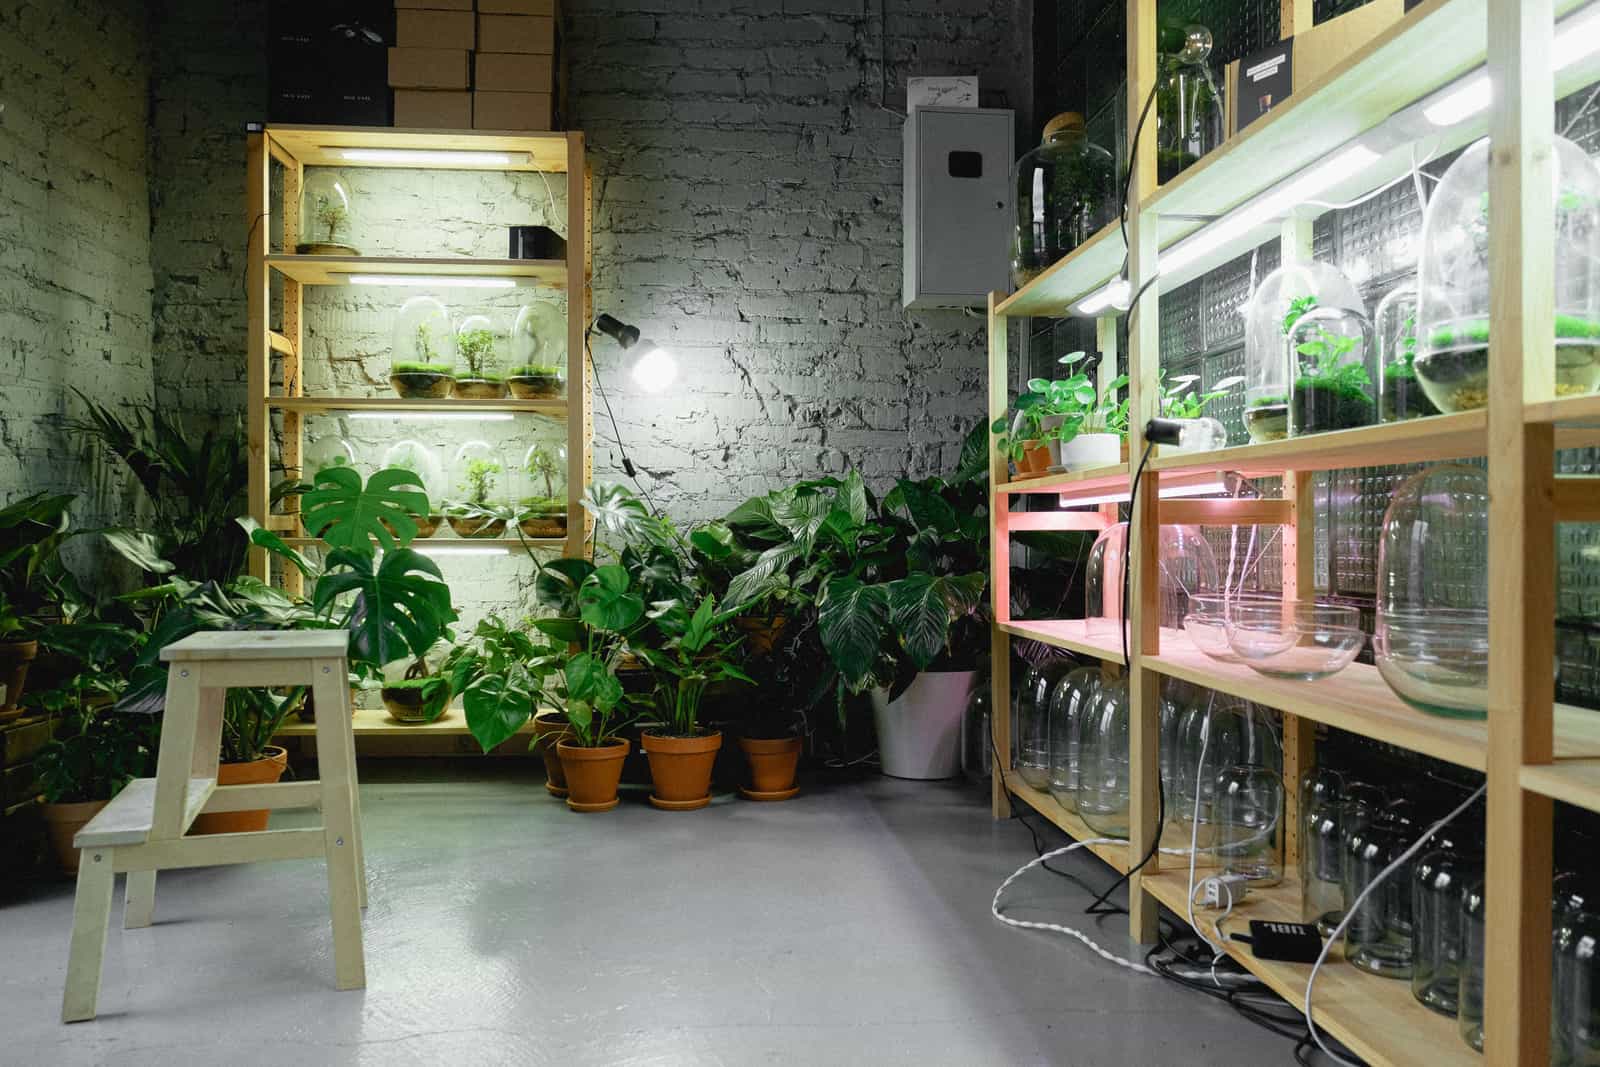
Photographs on this site are licensed stock and are illustrative of the fixture type. We do not own the units we write about.
How this page is funded: the buy links here are Amazon Associates links, and we earn a commission on qualifying purchases at no extra cost to you. We have not been paid to feature anything on this page, we accept no free product, and commission plays no part in the ranking. Full disclosure.
We have not tested these units. Everything below comes from the manufacturer’s own published specifications, or from arithmetic we have shown our working for. Where a figure is not published, we say so instead of estimating one. Read the method.
Quick picks
Efficacy is photons out per joule in. Where a manufacturer publishes it we quote theirs; where they publish photon output and wattage but not efficacy, we divide and label it as ours; where they publish neither, the cell says so rather than guessing. Tap a row for the full write-up.
| # | Product | Best for | Efficacy | Price |
|---|---|---|---|---|
| 1 | 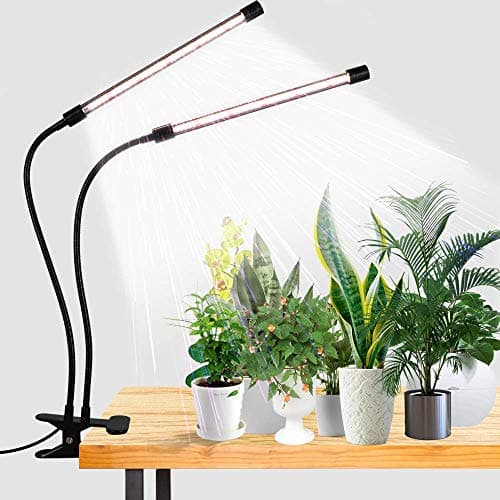 GooingTop Clip Grow Light The cheapest way to put real light on one plant on one desk, and honest about being exactly that — a 10 W clip lamp with a repeating timer. | Low-band plants | Not published | |
| 2 | 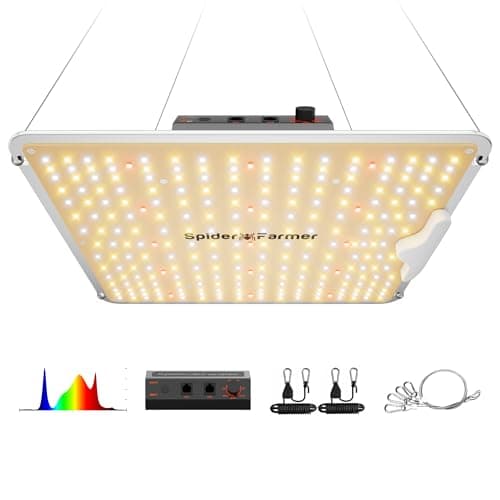 Spider Farmer SF1000 Publishes PPF to two decimal places and an efficacy figure that actually divides out of it. That internal consistency is rarer in this category than it should be. | Medium-band shelves | 2.5 umol/J | |
| 3 | 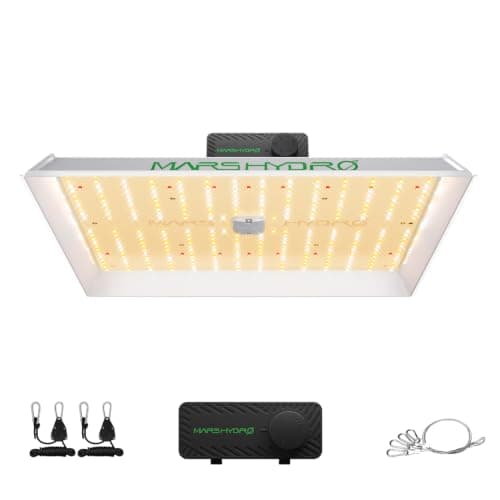 Mars Hydro TS 1000 The most photons of anything on this list, and one of only three fixtures here that publishes both PPF and efficacy so the claim can be checked against itself. | High-band greens | 2.3 umol/J |
The reasoning
This is a reference page. The bands come from University of Minnesota Extension’s guidance on lighting for indoor plants; the DLI conversions are ours, computed with the standard formula and shown below so you can check them.
The published bands
Low is 50–150, medium is 150–250, high is 250–450, per University of Minnesota Extension. Nearly every indoor plant a home grower keeps sits somewhere in that span.
What each band implies as a daily total
PPFD is a rate. What a plant actually accumulates depends on how long the light is on, so the same fixture serves a very different plant at 12 hours than at 16.
| PPFD (µmol/m²/s) | 12 h | 14 h | 16 h |
|---|---|---|---|
| 50 | 2.2 mol | 2.5 mol | 2.9 mol |
| 100 | 4.3 mol | 5.0 mol | 5.8 mol |
| 150 | 6.5 mol | 7.6 mol | 8.6 mol |
| 200 | 8.6 mol | 10.1 mol | 11.5 mol |
| 250 | 10.8 mol | 12.6 mol | 14.4 mol |
| 300 | 13.0 mol | 15.1 mol | 17.3 mol |
| 400 | 17.3 mol | 20.2 mol | 23.0 mol |
Reading that against the seedling target of about 12 mol/m²/day published by University of New Hampshire Extension: you need roughly 250 µmol/m²/s at 14 hours, or about 200 at 16. Both are ordinary numbers for a modest fixture over a modest area.
Common indoor plants, mapped to the bands
These placements follow the extension guidance on light requirements for indoor plants. Where a plant is genuinely contested we say so rather than picking a side.
| Plant | Band | Target PPFD | Notes |
|---|---|---|---|
| Pothos, snake plant, ZZ | Low | 50–150 | These tolerate low light rather than preferring it; they grow noticeably faster nearer the top of the band |
| Ferns, calathea, peace lily | Low | 50–150 | Bright indirect in practice; direct high-intensity light scorches them |
| Monstera, philodendron, rubber plant | Low to medium | 100–200 | Bigger leaves and shorter internodes toward the top of the range |
| Seedlings and transplants | Medium to high | 200–300 | The 12 mol/m²/day target; the range where stretching stops |
| Basil, mint, leafy herbs | High | 250–400 | Herbs get leggy and flavorless below this; the most under-lit plant in most homes |
| Lettuce, salad greens, microgreens | High | 250–400 | Fast growth is the point; below the band they bolt or stall |
| Succulents and cacti | High | 300–450 | The etiolation you see on windowsill succulents is a light deficit, not a watering problem |
| Fruiting crops indoors | Above the published bands | 450+ | Genuinely demanding; a home fixture over a small area is the only realistic approach |
How to use this table honestly
Two warnings. First, these are bands rather than setpoints: a pothos at 160 µmol/m²/s is not in distress, it is simply growing faster than one at 60. Second, plants adapt to what they have had. Moving a plant that has spent two years in a dark corner directly to 400 µmol/m²/s will bleach the leaves it grew for low light. Step it up over two or three weeks.
You want 300 µmol/m²/s over a 2 × 2 ft area of herbs.
Area = 4 sq ft = 0.372 m².
Required PPF = 300 × 0.372 ÷ 0.8 = 140 µmol/s.
The SF1000’s published 249.21 µmol/s covers that with substantial margin — meaning you could dim it, raise it, or cover a larger area.
Do the same for your own numbers in the coverage calculator, or read the sizing logic in full in what size grow light do I need.
Every pick in full
GooingTop Clip Grow Light
Clip lightLow-band plants
The cheapest way to put real light on one plant on one desk, and honest about being exactly that — a 10 W clip lamp with a repeating timer.
What GooingTop publishes
- Power draw
- About 10 W (source)
- Spectrum
- 6000 K, 74 white plus 10 red LEDs, CRI 95 (source)
- Dimming
- Five brightness levels; repeating 4 / 8 / 12 hour timer (source)
What GooingTop does not publish
- PPF in umol/s
- PPFD at any distance
- Photon efficacy in umol/J
- The manufacturer publishes no spec sheet at all; the figures above come from the retail listing
Who should skip it
Skip it if the plant is more than about a foot across, or if you want any number at all before you buy — nobody publishes photon data for this fixture.
Spider Farmer SF1000
LED panelMedium-band shelves
Publishes PPF to two decimal places and an efficacy figure that actually divides out of it. That internal consistency is rarer in this category than it should be.
What Spider Farmer publishes
- Power draw
- 100 W +/-5% at 100-277 V AC (source)
- PPF (photon output)
- 249.21 umol/s (source)
- Efficacy
- 2.5 umol/J (source)
- Stated coverage
- 2 x 2 ft core, 3 x 3 ft maximum (source)
- Spectrum
- 650-665 nm, 730-740 nm, 2800-3000 K, 4800-5000 K (source)
- Diodes
- Bridgelux (source)
- Dimming
- Yes, dimming knob (source)
- Dimensions
- 32.5 x 29.0 x 5.9 cm (source)
- Rated life
- 55,000 hours (source)
Our arithmetic
- Does the published efficacy check out against the published PPF?: Yes — 2.49 umol/J computed against 2.5 umol/J published
249.21 umol/s / 100 W = 2.4921 umol/J. The published 2.5 umol/J is that number rounded. Not every brand's two figures agree like this, which is exactly why we divide them. - Average PPFD across its 2 x 2 ft core footprint: about 536 umol/m2/s
2 ft x 2 ft = 4 sq ft = 0.372 m2. 249.21 / 0.372 = 670 umol/m2/s at perfect uniformity; at a 0.8 uniformity factor, about 536 umol/m2/s.
Who should skip it
Skip it if raw output is what you are buying — the TS 1000 delivers 38% more photons per second, at the cost of 50 W more draw.
Mars Hydro TS 1000
LED panelHigh-band greens
The most photons of anything on this list, and one of only three fixtures here that publishes both PPF and efficacy so the claim can be checked against itself.
What Mars Hydro publishes
- Power draw
- 150 W +/-5% at 100-277 V AC (source)
- PPF (photon output)
- 343 umol/s (source)
- Efficacy
- 2.3 umol/J (source)
- Stated coverage
- 2.5 x 2.5 ft vegetative, 2.3 x 2.3 ft flowering (source)
- Spectrum
- 660-665 nm, 730-740 nm, 3000 K, 5000 K (source)
- Diodes
- Bridgelux (source)
- Dimming
- Yes, 0-100% dimmer knob (source)
- Dimensions
- 406 x 326 x 50 mm (source)
Our arithmetic
- Average PPFD across its stated 2.5 x 2.5 ft vegetative footprint: about 470 umol/m2/s
2.5 ft x 2.5 ft = 6.25 sq ft = 0.581 m2. 343 umol/s divided by 0.581 m2 = 590 umol/m2/s at perfect uniformity; applying a 0.8 uniformity factor gives about 472 umol/m2/s average. - Electricity used at 14 hours a day for 30 days: 63.0 kWh a month
150 W x 14 h x 30 d / 1000 = 63.0 kWh.
Who should skip it
Skip it if you are lighting a bookshelf. 343 umol/s concentrated into a 2.5 ft square is far more light than a monstera wants, and you pay 150 W to deliver it.
Questions people actually ask
+How much PPFD do houseplants need?
+What DLI do seedlings need?
+Can a plant get too much light?
+Why do different sources give different PPFD numbers for the same plant?
Sources
- University of Minnesota Extension — Lighting for indoor plants and starting seeds — consulted September 2, 2026
- University of New Hampshire Extension — Growing Seedlings Under Lights — consulted September 2, 2026
- Virginia Cooperative Extension — Calculating and Using Daily Light Integral (DLI), SPES-720 — consulted September 2, 2026
- Iowa State University Extension — Important Considerations for Providing Supplemental Light to Indoor Plants — consulted September 2, 2026
- Spider Farmer — SF1000 published specification table — consulted September 2, 2026
Read next
Houseplants
Grow Lights for African Violets
The medium-band target for violets, why a collection wants linear fixtures, and honest placement.
Top pick
Barrina T5 4ft Grow Light Strips
Houseplants
What Plants Benefit From Grow Lights?
Plants ranked by how much a fixture actually changes the outcome, not by their light band.
Top pick
Barrina T5 4ft Grow Light Strips
Houseplants
Grow Lights for Snake Plants
The low-light band, the exact lamp height that hits it, and why tolerating is not the same as thriving.
Top pick
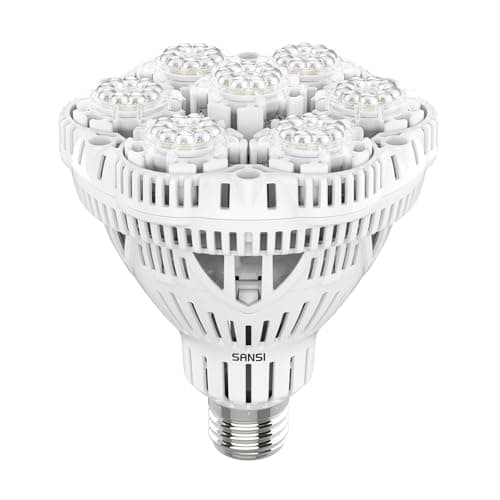
SANSI 36W BR30 Grow Light Bulb

Coverage & Sizing
Grow Light Coverage Calculator
Put in PPF, area and hours; get PPFD and DLI scored against published extension bands.
Top pick
Mars Hydro TS 1000
Coverage & Sizing
What Size Grow Light Do I Need?
Size from area and target, not from watts. The sum, plus a lookup table by area.
Top pick
SANSI 36W BR30 Grow Light Bulb
Spectrum & PPFD
PAR, PPFD and DLI, Explained
The three photon units, what each measures, and the conversions between them, shown.
Top pick
Spider Farmer SF1000
Houseplants
How Much Light Do Houseplants Need in Winter?
Published DLI bands by plant type, and how to work out what your winter window is short by.
Top pick
SANSI 36W BR30 Grow Light Bulb
Houseplants
Grow Lights for Carnivorous Plants
Full-sun bog plants. Why most houseplant lights fall short, and the three fixtures that do not.
Top pick
Mars Hydro TS 1000
Houseplants
Grow Lights for Calathea
A 3-6 mol/m2/day low-band plant. Why the small bulb wins, and why crispy edges are not a light problem.
Top pick
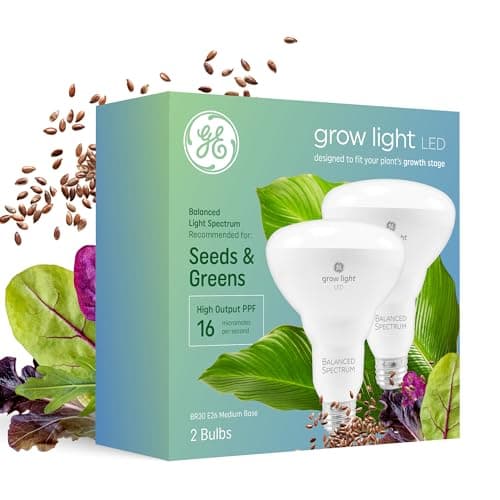
GE Grow Light BR30 Bulb, Seeds and Greens (2-pack)
Houseplants
Grow Lights for Peace Lily
Survives at 3-6 mol/m2/day, flowers at 6-10. The distance that separates them, and why a light is not a bloom switch.
Top pick
SANSI 36W BR30 Grow Light Bulb
Houseplants
Grow Lights for Bird of Paradise
Nearly full sun is the requirement. What a fixture can actually deliver over a 3 ft canopy, and what it cannot.
Top pick
Mars Hydro TS 1000
Where this sits
This page belongs to Coverage and Sizing Math. Every figure on it is either quoted from a named published source or derived in view — the full method is on our methodology page, and how the site is funded is on the affiliate disclosure.